Outline VPN: How to Access Performance Metrics?
Note: looking for a free Outline VPN? Try my bot: https://t.me/hidemail_vpn_bot
First, you need to open the Prometheus dashboard.
- Connect to your server and forward port 9090:
ssh ${YUOR_USERNAME}@${YOUR_SERVER} -L 9090:localhost:9090
Open https://localhost:9090/graph on your browser
Write the PromQL query you need. See the examples below.
Example Queries
Usage
Data Bytes
By access key, protocol and direction
increase(shadowsocks_data_bytes[1d])
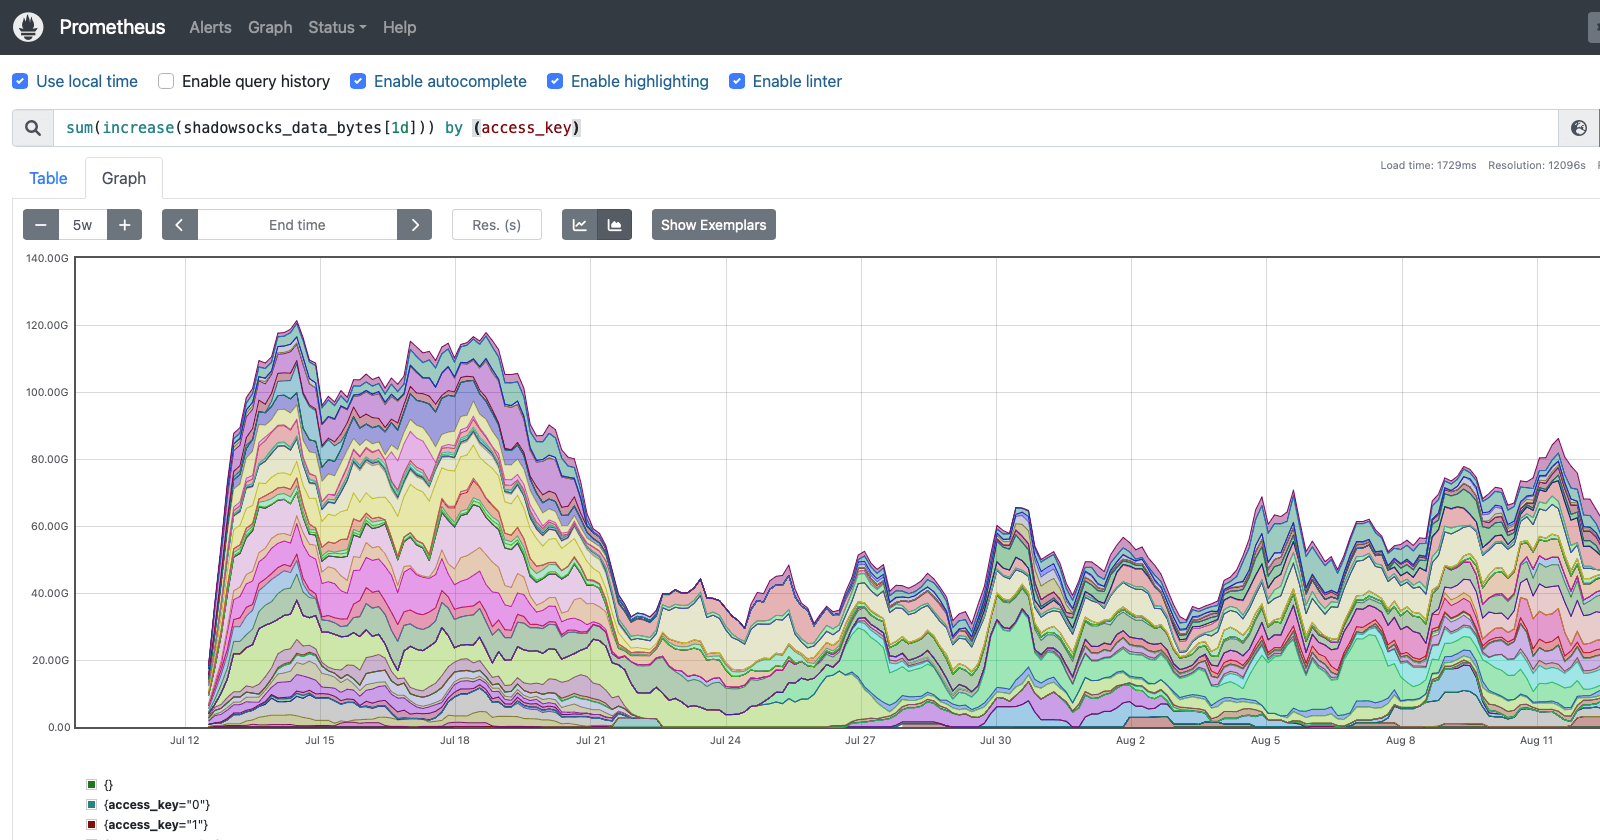
To aggregate by access key only:
sum(increase(shadowsocks_data_bytes[1d])) by (access_key)
This is the query used to calculate the usage for data limits (from manager_metrics.ts):
sum(increase(shadowsocks_data_bytes{dir=~"c<p|p>t"}[30d])) by (access_key)
By location, protocol and direction
increase(shadowsocks_data_bytes_per_location[1d])
Active Access Keys
sum(max(max_over_time(shadowsocks_data_bytes{access_key!=""} [1h])) by (access_key) > bool 0)
TCP connections
By access key, location and status
increase(shadowsocks_tcp_connections_closed[1d])
By location
increase(shadowsocks_tcp_connections_opened[1d])
UDP
Packets by location and status:
increase(shadowsocks_udp_packets_from_client_per_location[1d])
Associations (no breakdown):
increase(shadowsocks_udp_nat_entries_added[1d])
Performance
CPU usage by process:
rate(process_cpu_seconds_total[10m])
Memory by process:
process_virtual_memory_bytes
Reference
The full list of metrics provided by outline-ss-server can be found in its source code from line 61.
As curl GET request
If you want, you also can get the same data with CURL (GET request), for example, to get data usage (in bytes) by specific access key (1) for the last day:
curl -g 'http://127.0.0.1:9090/api/v1/query?query=sum(increase(shadowsocks_data_bytes{access_key="1"}[1d]))by(access_key)'